


You can control the activities, you can’t control the sales outcome. If you try to do this, you are already late.
We all understand the whole mantra “you can’t improve what you don’t measure” and know the benefits of sales activity tracking.
But from understanding to successful application is a long path - and sometimes obscure and uncertain. Copy cat doesn’t really work. Otherwise, there would be many successful Apples and Microsofts today.
The truth is, every industry, product and customer market is slightly different.
That leads us to our blog series on Sales Activity Management, outlining sales activity management into industry-specific KPIs and metrics, which are:
As a the first part of our series on Sales Activity Management, this guide will run you through the basic bits and pieces in sales tracking for every sales team.
The difference between metrics and KPIs is very simple.
Metric, by definition, means “a set of figures or statistics that measure results.” That is, in this digital age, anything that can be measured is a metric.
On the other hand, KPI stands for Key Performance Indicator, which is pretty self-explanatory itself. If you’re doing well in these areas, for example the number of opportunities created, chances are very likely that you’ll reach your goals.
Out of the 300 metrics considered as key performance indicators by sales leaders in a survey by Vantage Point Performance and The Sales Education Foundation, only 17% are in our control.
That means, we can directly influence 51 metrics to achieve our goals. But how can you keep an eye on that amount of metrics without risking micro-managing and a narrow view?
Intuitively, you would have an idea about the key activities that bring in more deals for the company. And it goes without saying that the key selling activities differ according to industry and your sales organization.
Another important piece of the puzzle is to try to measure activities that really work for your sales team. Discuss with well-performing sales reps and refer to activity history to draw some correlations.
Reverse engineering the sales process means that you would count backwards from the bottom of the funnel to the top of the funnel, drilling into what is needed at each stage to reach your highest-level goal: revenue.
This approach keeps your goal setting realistic and clearly lays out your short-term goals for individual sales rep.
For example, you want to achieve $50 million in annual revenue, and your average deal size is $25,000. Divide 50 million by 25,000, you’ll need 2000 deals.
If your hit-rate is 35%, you are gonna need 7000 proposals.
If 7 out of every 10 meetings proceed to the next stage of proposal, that means you’ll need 10,000 meetings.
Then you break the metrics down by time period.
Next, divide the numbers to each salesperson in your team. Remember to take into consideration their individual hit rate. Let’s say you have 100 reps on your team, the final numbers would be:
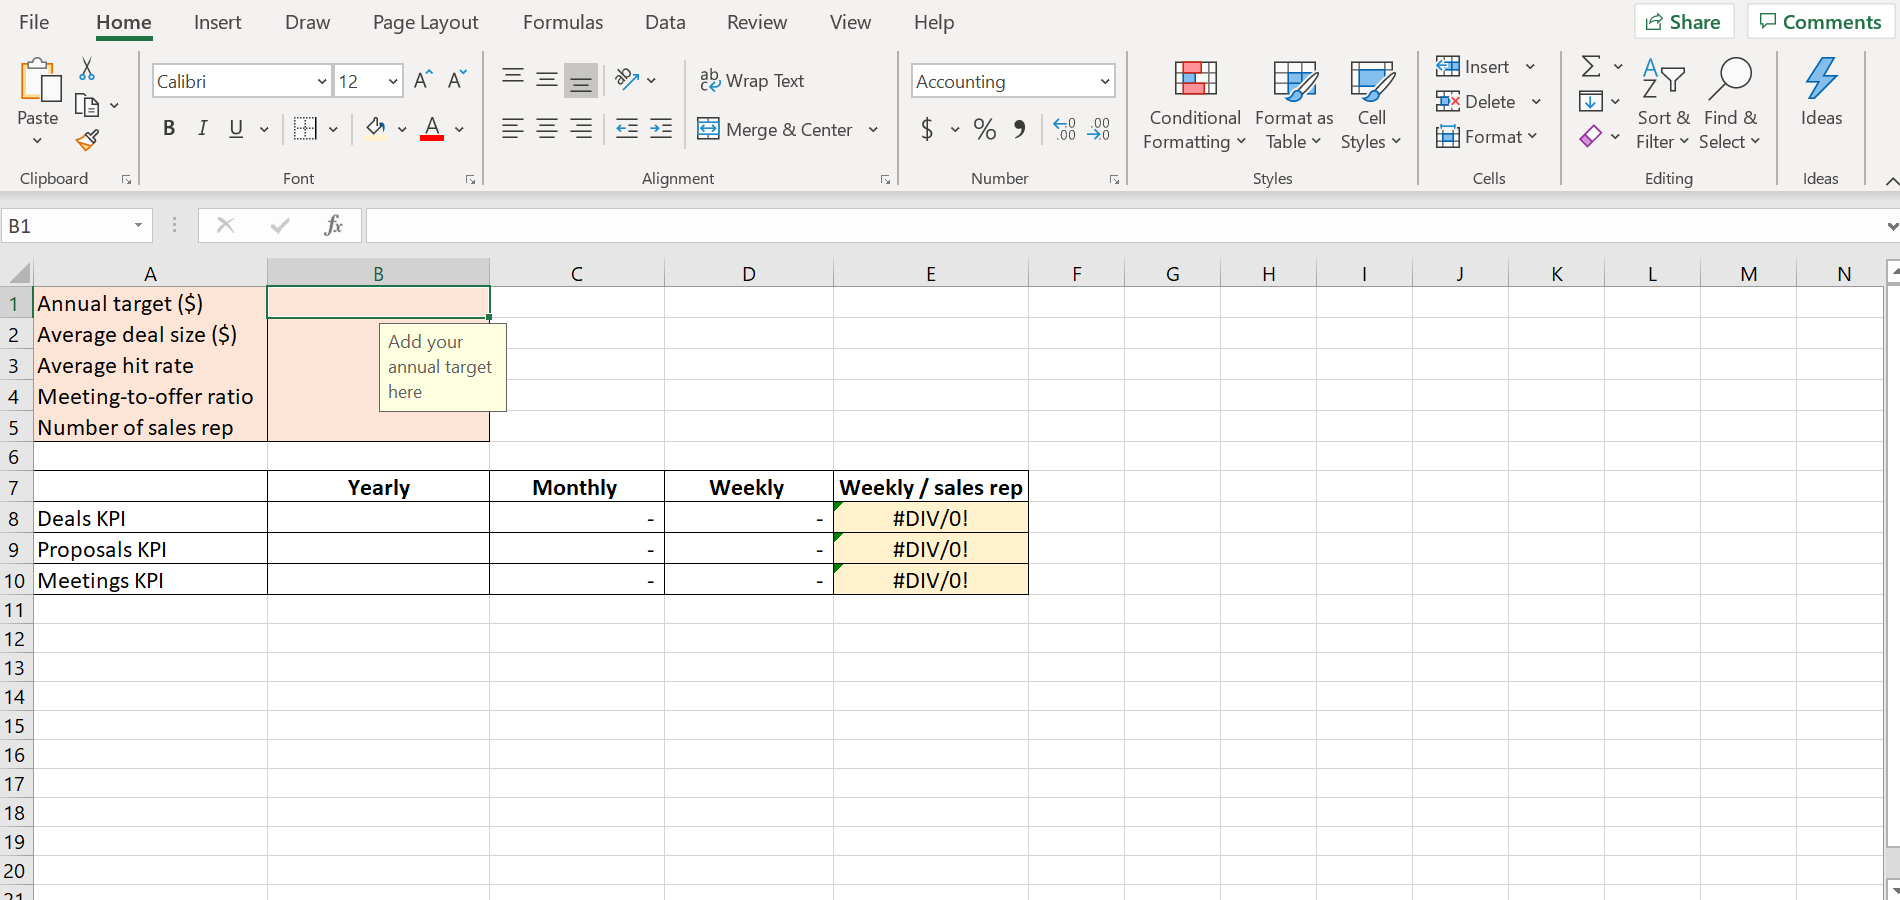
Want to save some time from the actual calculation? You can grab our ready-made Sales KPIs Excel template for calculating your sales KPIs according to those formulas.
Download this excel sheet to calculate your sales KPI automatically
Once you have set your mind on the KPIs, keep your eyes on it.
Otherwise, what’s the point of setting and calculating them in the beginning?
Live and breathe your metrics everyday.
The level of sales activities is the pulse of your sales performance. And as we’re all running against a timeline, keeping track of your KPIs performance lets you know how far away from the target your team is, and what should be done in time to fix.
It’s one thing to plan and set targets for the entire team and it’s another to get people excited about that. How do you convince your sales people of the benefits of activity logging and tracking, without coercive power?
Remember, people don’t do things that are not in their interest (same thing applies to your customers).
One of the easiest ways to clearly communicate your KPIs and sales goals to the team is through visual reports. This enables your sales reps to self-monitor and track their own sales activities, without needing to wait until the next review.
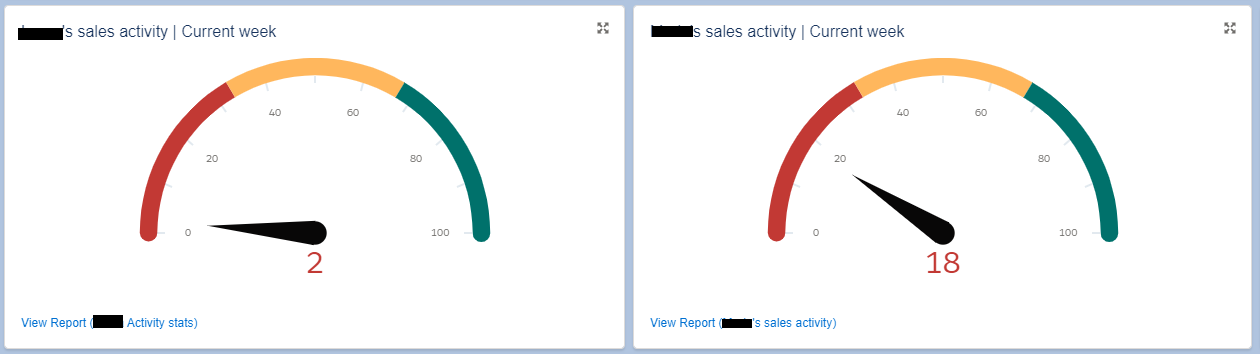
When automated data entry is enabled, it’s easy to have accurate and personalized data. This way, sales managers would be able to instruct and guide sales reps based on objective data.
Some sales reps may excel in meetings, some may struggle with prospecting. But the thing is if you as a team leader and your sales rep don’t recognize their own unique strengths and weaknesses, improvement and scaling are most likely to be much tougher.
Upcoming post: The most important KPIs for SaaS sales team


No Comments Yet
Let us know what you think