


According to SaaS Mag, the software space is over-crowded, saturated with 34,727 software products across 745 vertical sectors listed on the business software review site G2.
Even a product in a niche market is faced with fierce competition. Busy customers and choice fatigue are also among the top challenges facing SaaS sales reps. So it goes without saying that the more active sales reps are in their outreach efforts, the higher chances of opportunities they earn.
That is why sales activities tracking is even more crucial for SaaS sales. While you can’t directly influence your meeting-to-offer rate, you can make 50 calls, send out 100 emails every week. Regardless of the conversion rate, sales activities give you more learning points into the right and wrong things.
Without action, there is no feedback data to learn from. No insights. No improvement.
“We are what we repeatedly do. Excellence then, is not an act, but a habit.”
- Will Durant
In this second part of the Sales Activity Management series, we’ll run you through the most important KPIs on the sales activity and higher level.
Part 1: How to Set and Measure KPIs for Effective Sales Activity Management
Now before raising your eyebrows about micromanaging and unhappy sales reps, bear in mind that KPI is merely an indicator of sales success. And there are many paths to success, depending on each individual sales rep.
All that is to say, causation and correlation are two very different things.
That being said, calls and emails are still the top metrics for sales reps, because data on how active they are give you insights into why they are closing more or fewer deals.
Especially as SaaS sales organization is mainly inside sales, being on the phone and shooting emails fall into the top daily activities category.
How to calculate KPI goal:
Use your data history to calculate the average ratio of email-to-meeting and call-to-meeting. In order to reduce the flaw of averages, the data sample should be taken from sales reps who are hitting quotas on a steady level.
Then use the formula for reverse engineer sales process and count backwards how many calls & emails each sales rep need, based on their hit rate and meeting-to-offer rate.
Calls/ Emails KPI = (Individual quota) ÷ (Average email-to-demo rate x Meeting-to-offer x Hit rate)
There’s no debate about meetings as a KPI. If you don’t have demos, you have no deals. However as we look further into the details of booked demo, other factors come into sight:
At this point, quality is just as important as quantity. So as you set up and communicate the KPI to your team, be very clear on what is counted as a booked demo, and what is not.
Use filters for these criteria in the Salesforce reporting dashboard to steer your sales team into the right direction.
Every sales rep know by heart their hit rate, and every sales leader know how to calculate it. It’s simple, crucial math. How many deals do you close out of your demo meetings?
Obviously, the higher, the better. And the longer time frame, the more accurate the ratio.
But when it gets to set a KPI goal, it becomes harder to say which hit rate is a good hit rate. Every salesman wants to know how they perform against the average.
How to understand & increase win rate: Most often your hit rate is influenced by how good you are at booking the ideal customers and skilled in converting.
So if you are trying to fix something, those are the first areas to look at. Sometimes answering such questions might help:
Average time to conversion is the total duration of conversion from contact to customer. It’s also known as average sales cycle length.
Just like hit rate, average time to conversion usually shows a sales rep’s style and sometimes, sales skills. Sales leaders also use this number for predictability to forecast what your sales numbers look like two weeks or months down the line.
How to calculate:
Average time to conversion = (Total number of days from contact to customer of all deals) ÷ (Total number of deals)
Setting a KPI for sales cycle length is also a commonly used tactic for revenue acceleration. Generally, the sales cycle is shorter for a small-value deal and longer for a high-value deal. Conversion usually takes longer for outbound sales than inbound sales.
Because of that, take into consideration properties such as lead source, deal size and company sector in order to calculate the right benchmark.
Pipeline coverage is calculated by dividing your open pipeline by the quota.
Pipeline coverage = Open pipeline ÷ Quota
For those who are not familiar with the sales jargon (sales beginners, enthusiastic learners, welcome y’all), pipeline is the number of opportunities you have in the current month.
Say you now have 16 meetings so far, then that’s your pipeline.
Then open pipeline means the amount of open deals marked to close within the month. This formula depicts how many opportunities you’ve got compared to the quota to need to close. General rule of thumb is to have 3x or 4x pipeline coverage.
However, the number also depends on your win rate. If you can close 3 out of 10 deals, then you need 3.3x pipeline coverage, but if your hit rate is 70%, then you only need 1.4x pipeline.
How to use pipeline coverage:
Sales managers can use pipeline coverage for their sales strategy.
Strong pipeline coverage means sales reps should focus more on the later part of their sales process, to close more deals. On the other hand, if you have a weak pipeline coverage, meaning that you need to work more at the top of the sales funnel - generate more sales opportunities.
On a forward-looking basis, pipeline coverage gives you an idea of what the next two quarters look like, and what to do about them. If the sales team is strong on near-term pipeline but weak on future pipeline, very likely they’ll hit a really bad month or quarter. In this case, sales reps should be very active to keep the pace of creating more opportunities.
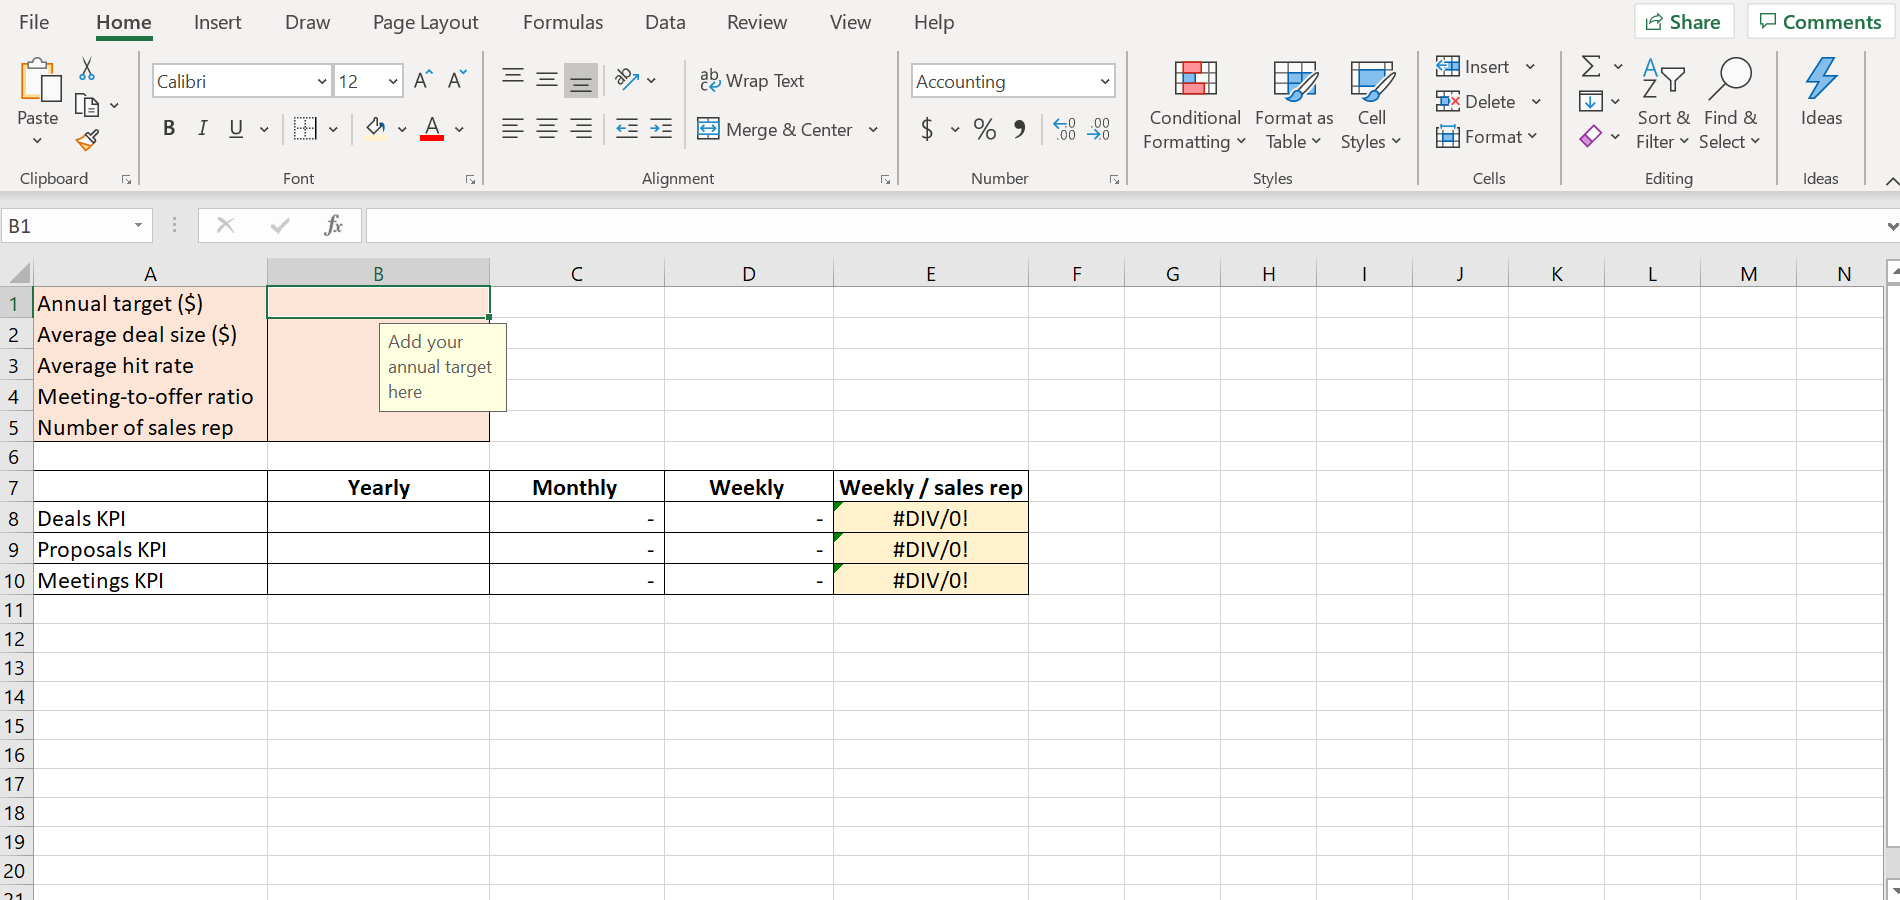
Grab our ready-made Sales KPIs Excel template for calculating your general sales KPIs by built-in formulas.
Download this excel sheet to calculate your sales KPI automatically
Every sales team is slightly different, so setting the right goals for KPIs has a huge impact on how much better sales performance can be.
That being said, KPIs, at the end of the day, are just numbers that need to be understood and interpreted. The more accurate data you get, the more actionable is your metric performance.
Next up: The Most Important Sales KPIs for Real Estate Industry


No Comments Yet
Let us know what you think