


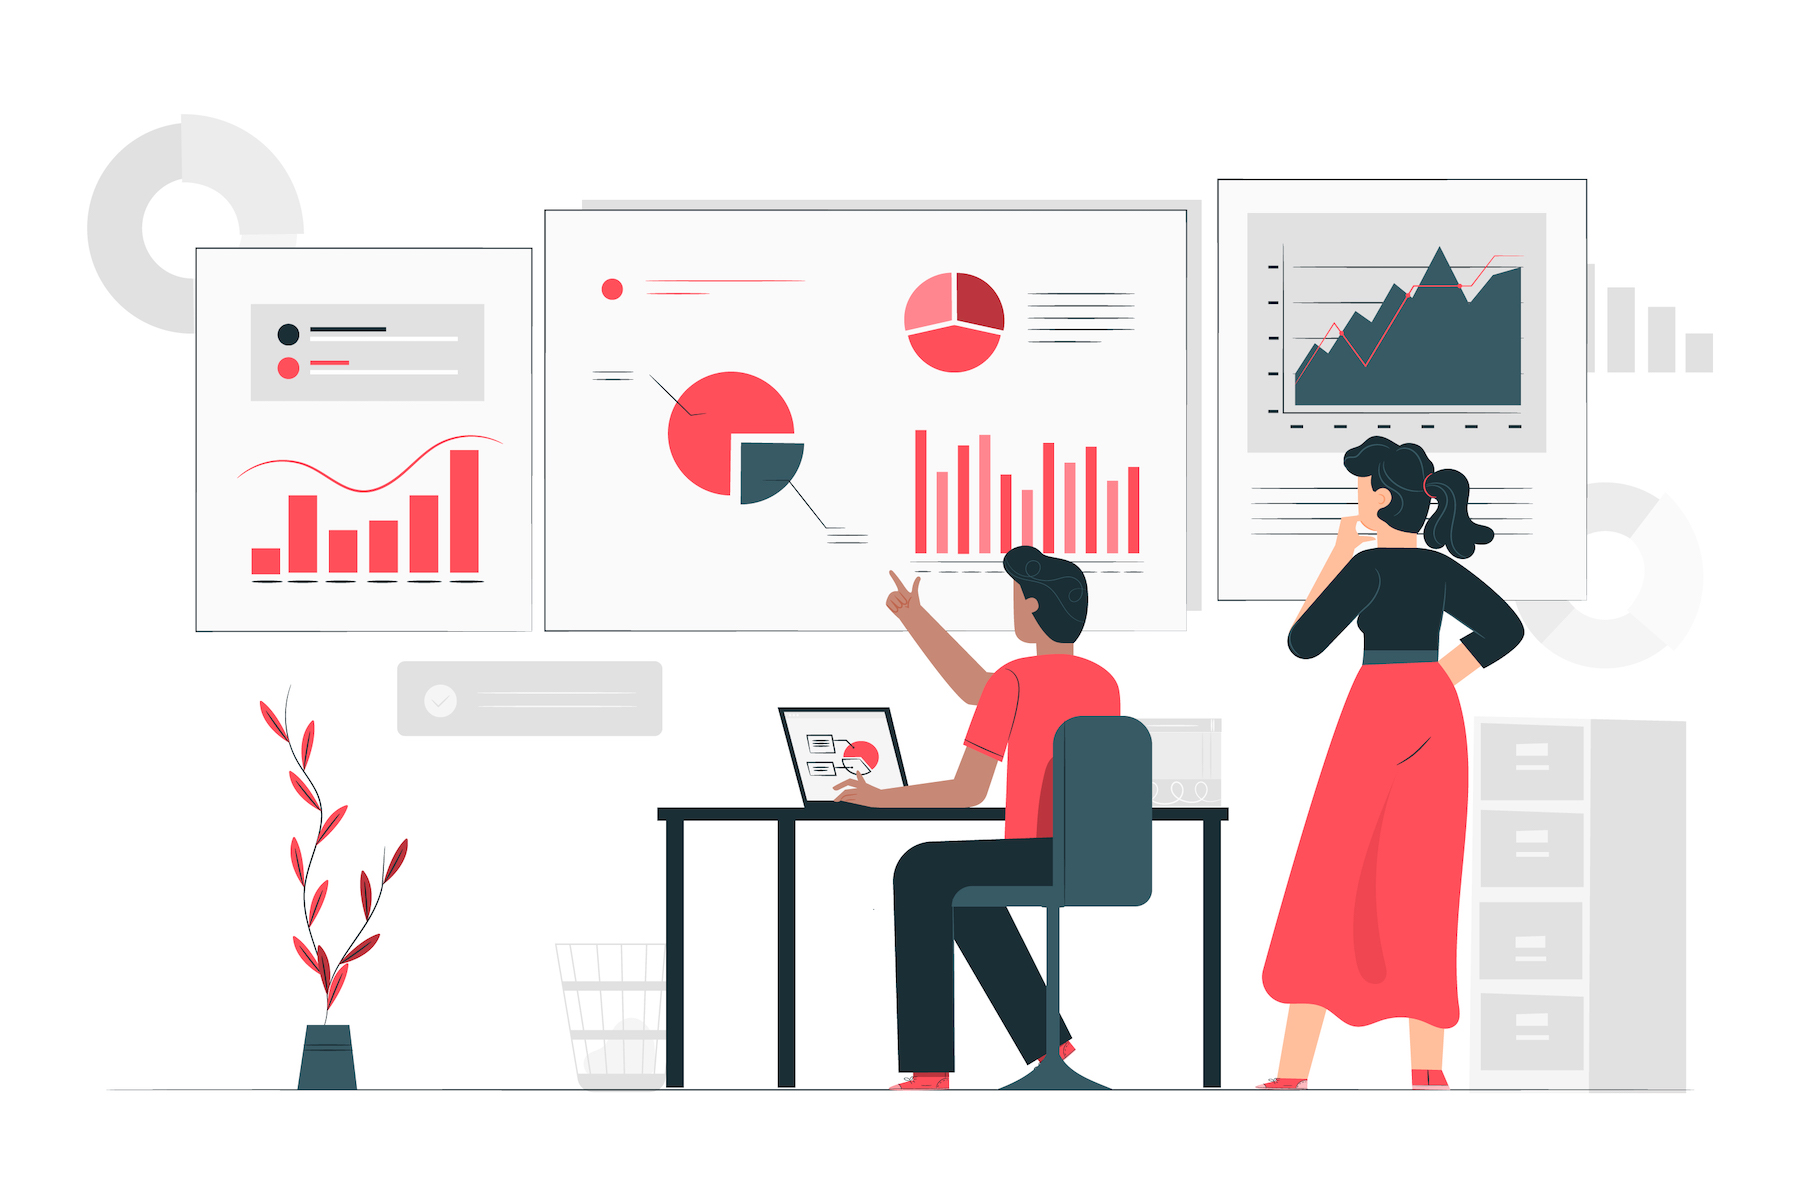

If your organization is using Salesforce, you’d want to make the most of it. So you head to Salesforce, create some reports, leave them there, and never touch them again. Or a bit better, you present those Salesforce dashboards with the entire team in the monthly meetings, where everyone smiles and nods while getting lost in the charts 😴 .
There’s gotta be a better way. And we’ll show you how.
When it comes to management, you get what you measure.
That is to say, if you report the number of meetings, you are telling your sales team to make more efforts in booking meetings.
Choose wisely what you want your sales team to spend their time, energy and talents on.
A good place to start is your sales goals. If you have already done reverse-engineering for your sales goals, you know which sales metrics you want to pay attention to.
We like to follow 2 types of sales metrics, which are activity metrics with Salestrail and result metrics. It is useful to selectively put different types of related metrics into groups because it makes the reports and dashboards easier to grasp.
Especially if you intend to use those Salesforce reports for sales analysis, having all components in one place could shed a light on what might be the issues in your sales team.
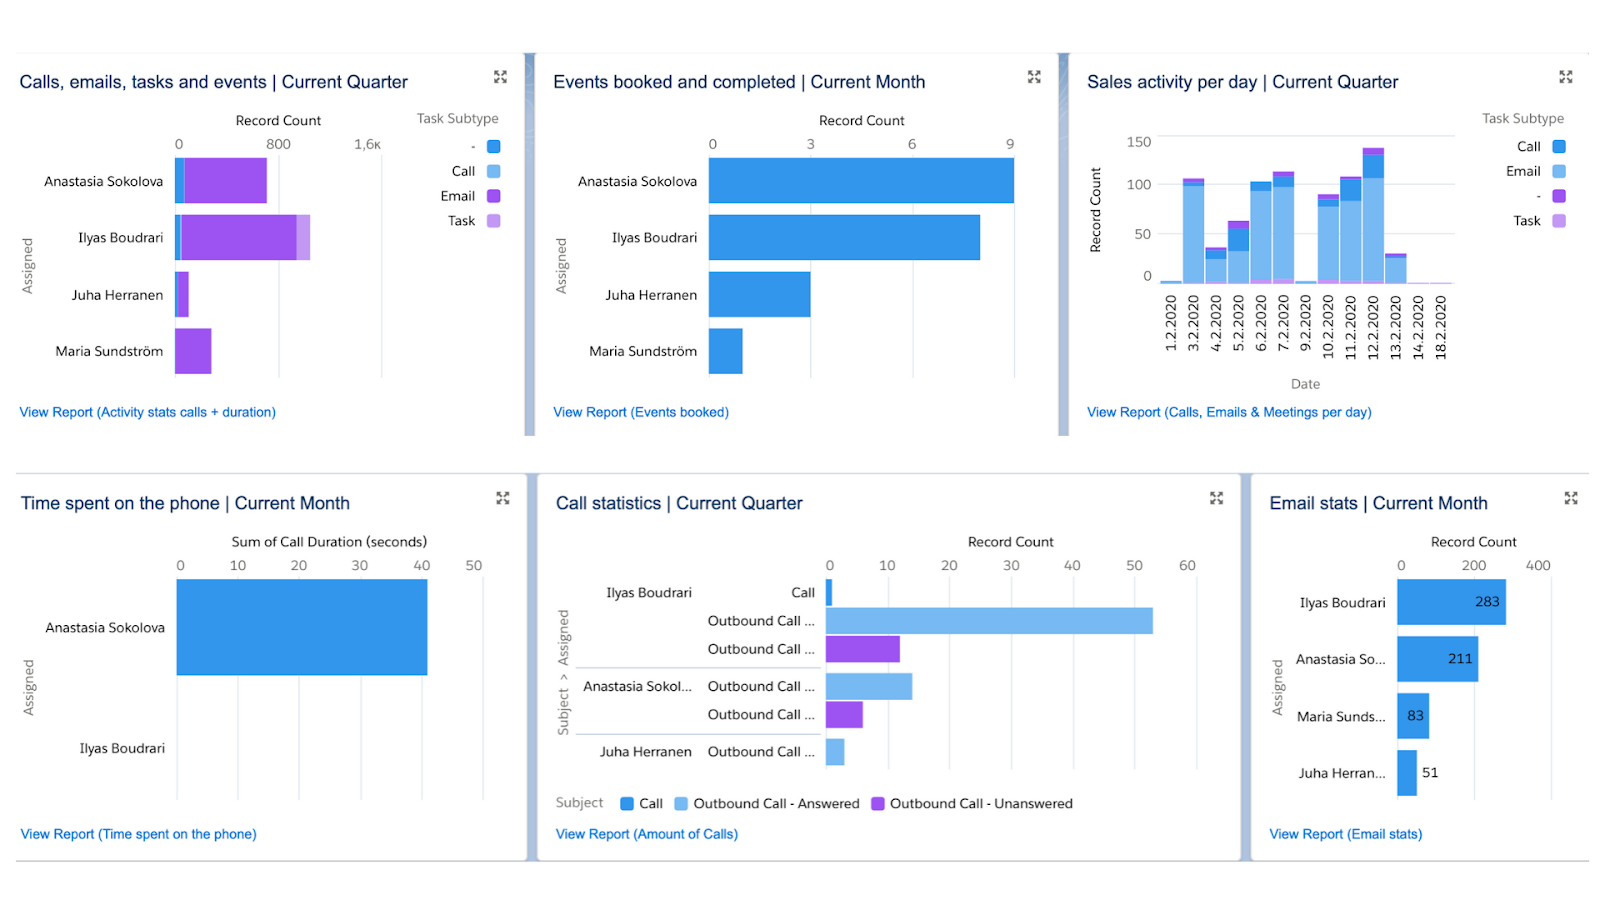
Sales activity performance dashboard
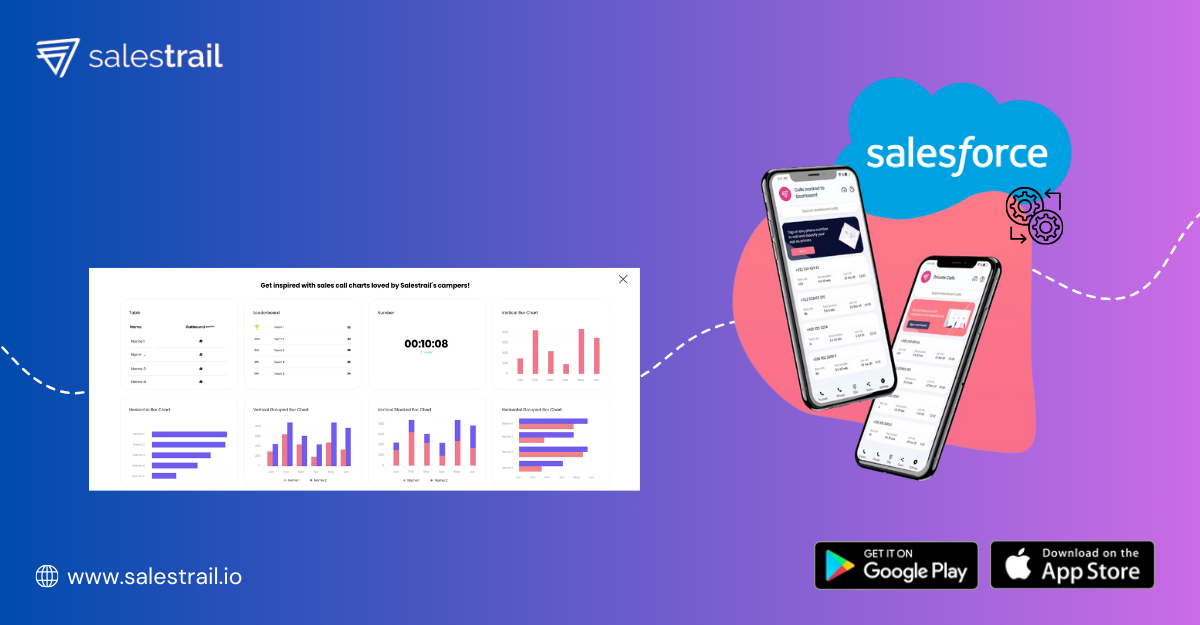
This guide is mainly for Salesforce Lightning interface as more companies have switched from Classic to Lightning, and Salesforce Lightning has more to offer users when it comes to reporting and data visualization.
If you have reasons to stick to Salesforce Classic, here’s a guide on how to create reports in Salesforce Classic.
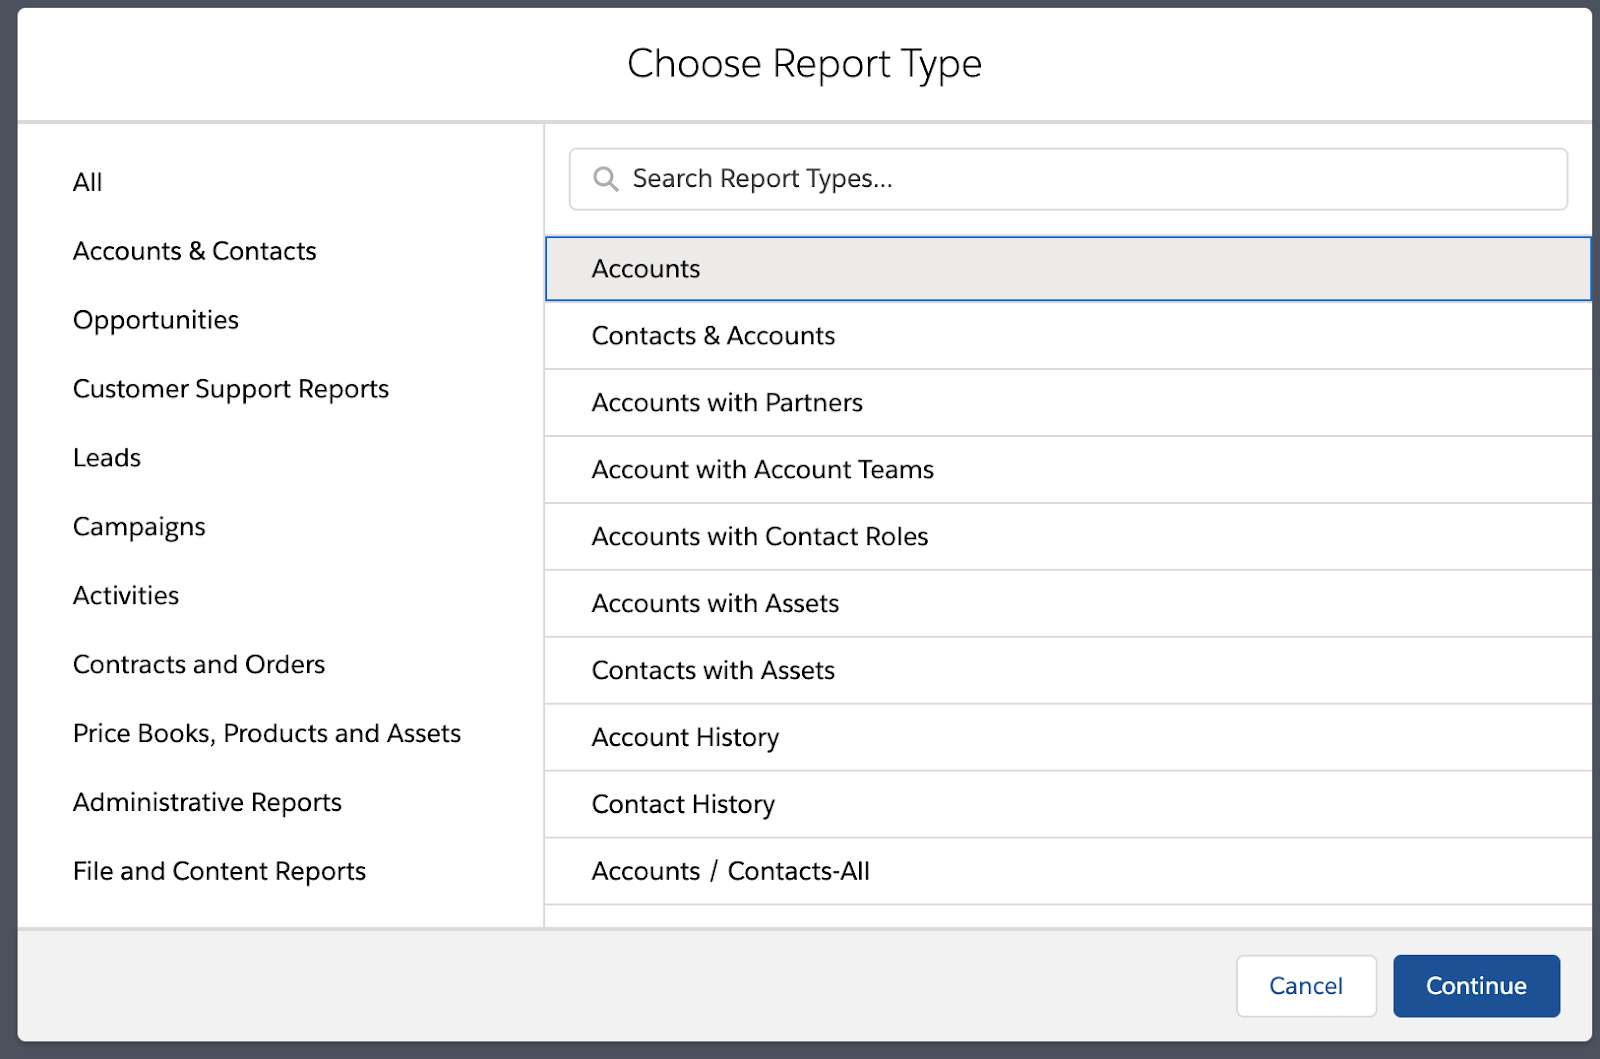
Step 1: Identify which Salesforce objects your sales metrics are related to
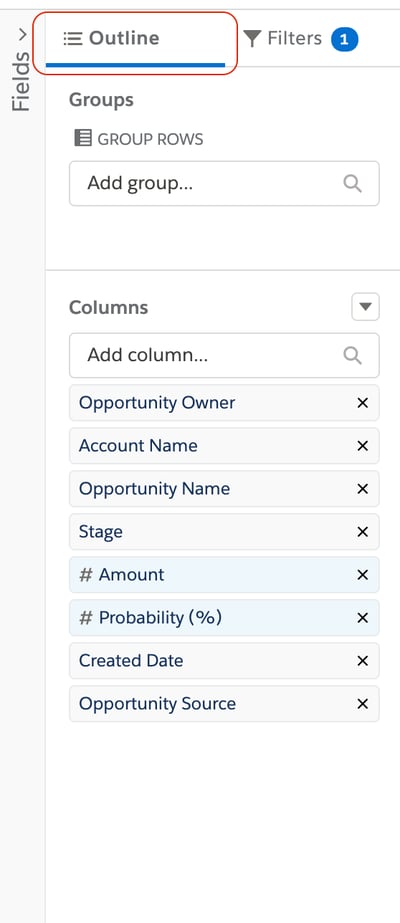
Step 2: Choose opportunity-related fields you want to display
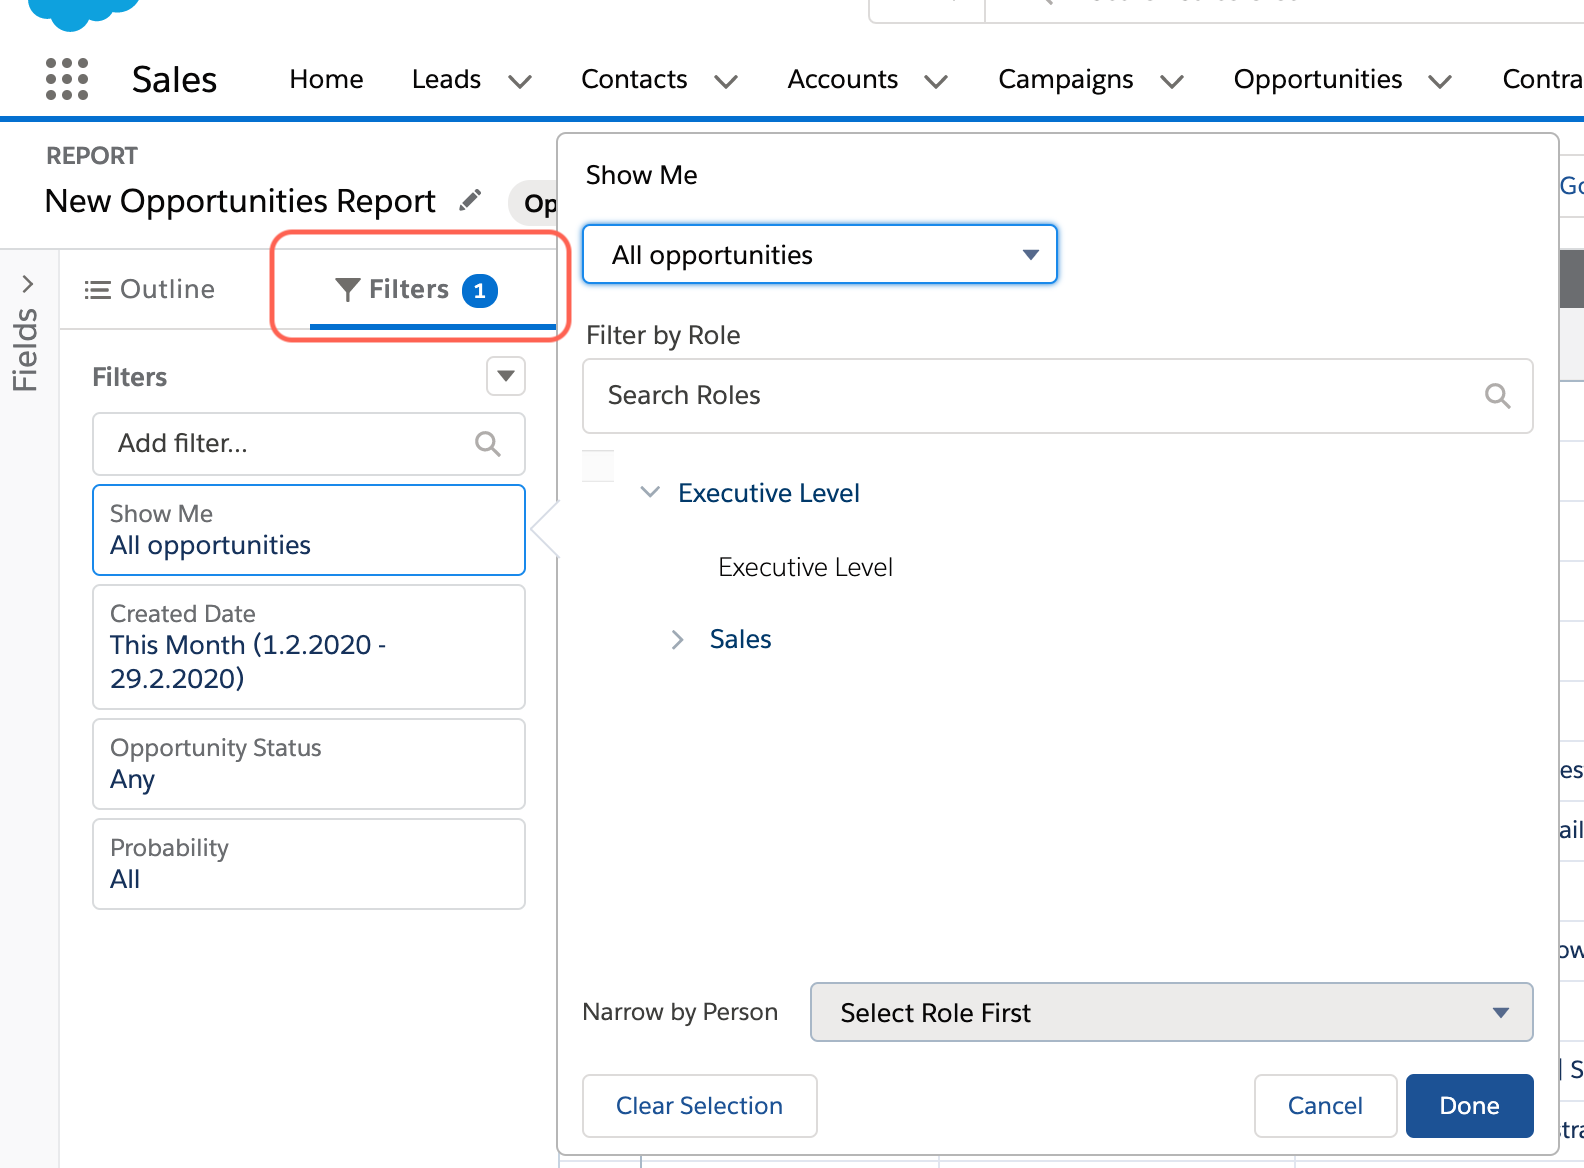
Step 3: Add filters to fine-tune your reports
Step 4: Add chart and run report for testing
Once you have added the chart, clicked "Run" to test your report numbers. Notice if there are any changes in the contextual settings you'd like to make, for example:
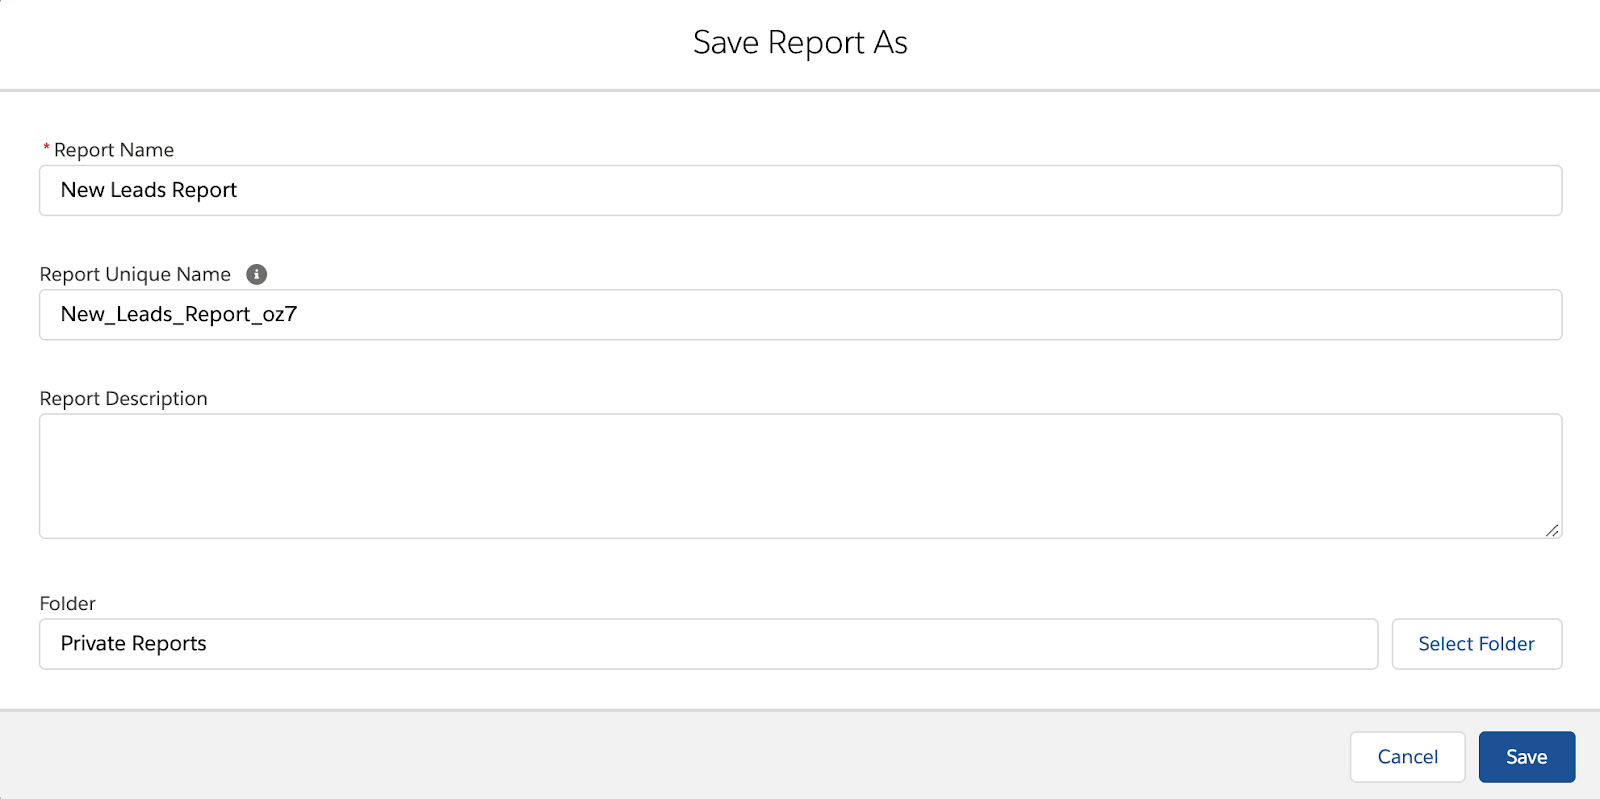
Step 5: Select report folder, permission and save report
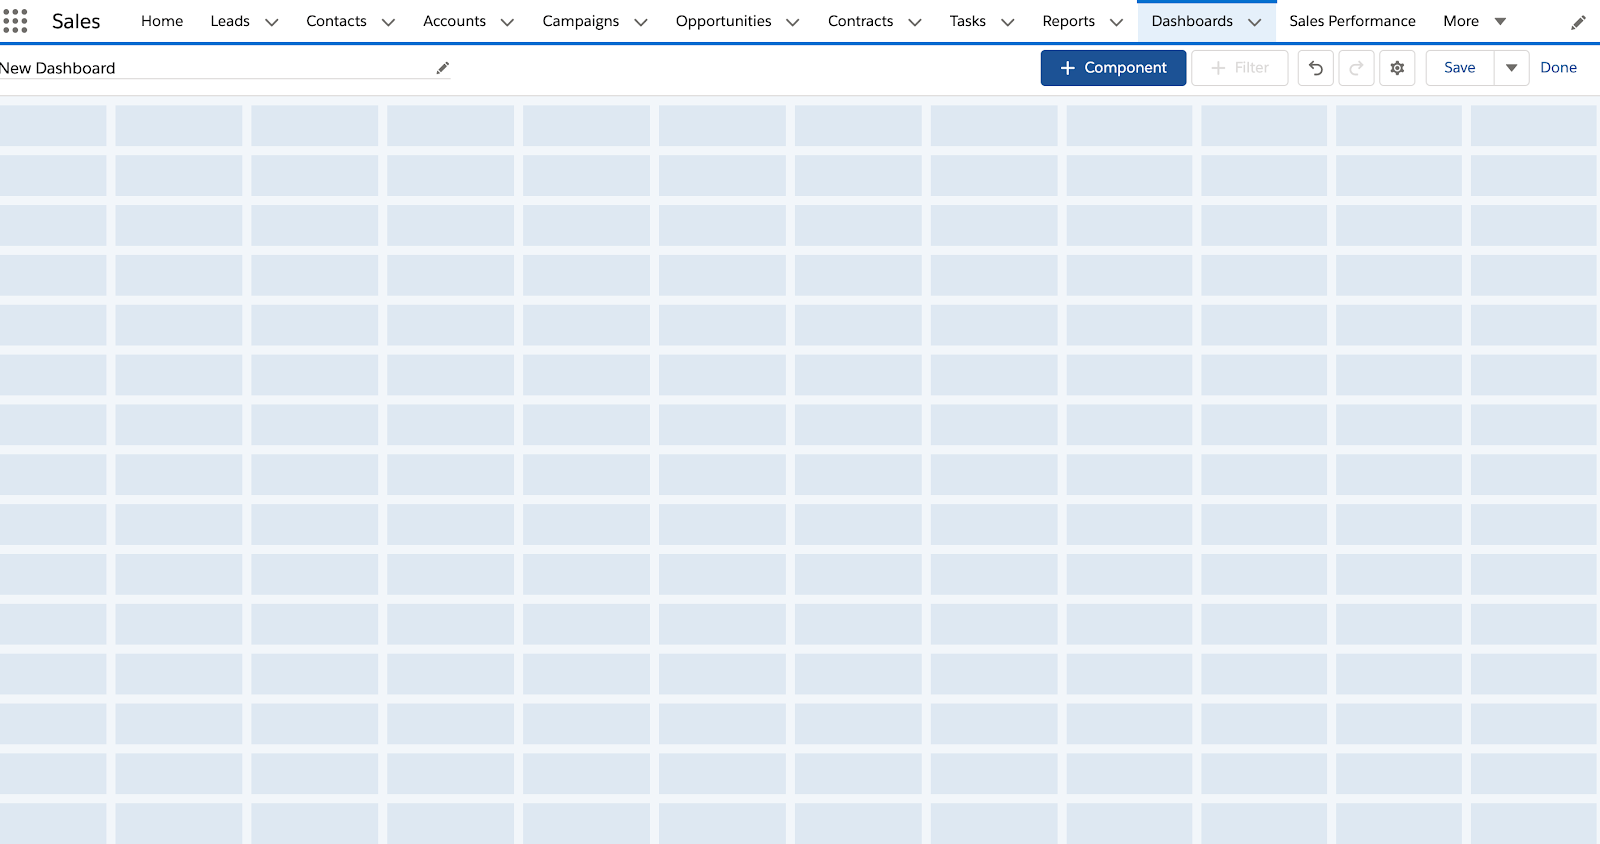
Step 1: New dashboard >> Add Component
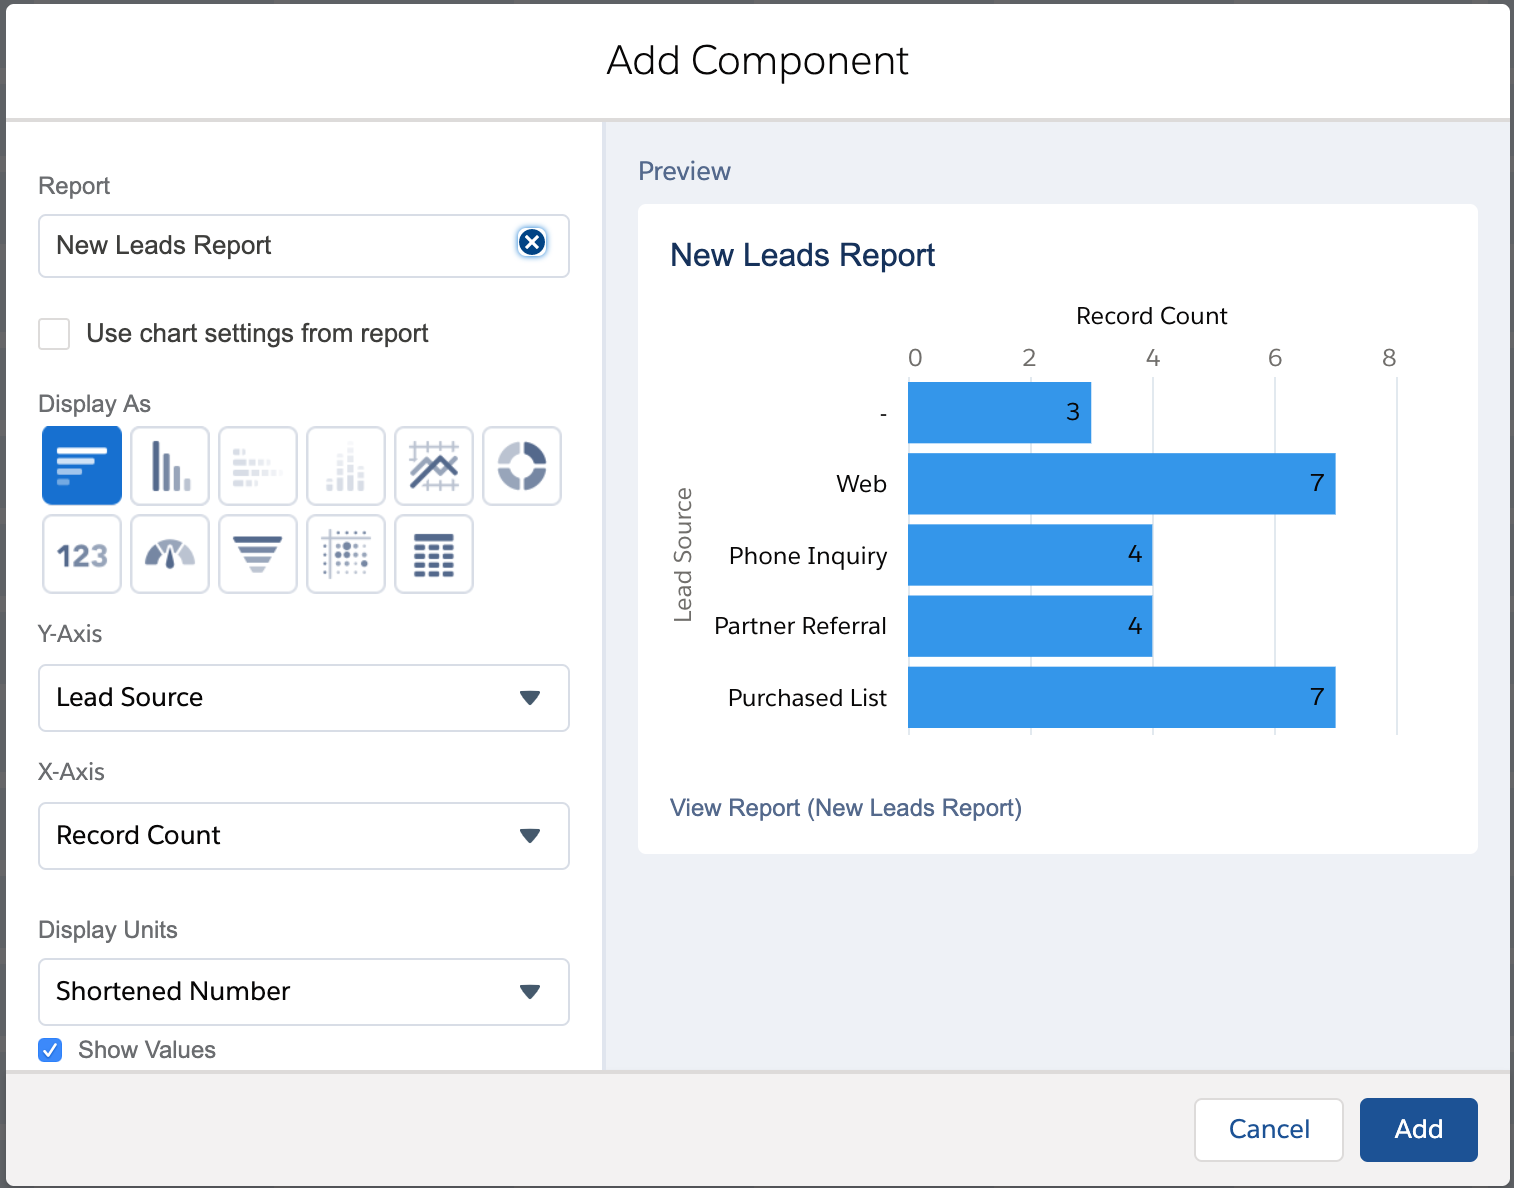
Step 2: Arrange report data
Some of other tools available to add more functionality to your Salesforce reports are:
The traditional process of reporting has been individualized to the sales managers and directors, leaving out good insights from the sales reps.
How could you know if the data is skewed because of some ad-hoc changes? Or some numbers are incorrect, outdated?
Remember, in accurate data is just as dangerous as no data.
For sales managers, this means giving access to your sales reports and actively seeking feedback from the team.
An easy way to do this is to share the reports before your monthly / quarterly meetings so that your team is somewhat prepared to share their thoughts.
We're not born with great Excel skills, but we learn them over time. It's exactly the same with reporting and presenting your reports. As you collect feedback from your team and stakeholders, you'll learn improve many facets of creating a helpful report for the whole team.
Here's our checklist to make sure we're creating good reports:
.jpg)


No Comments Yet
Let us know what you think